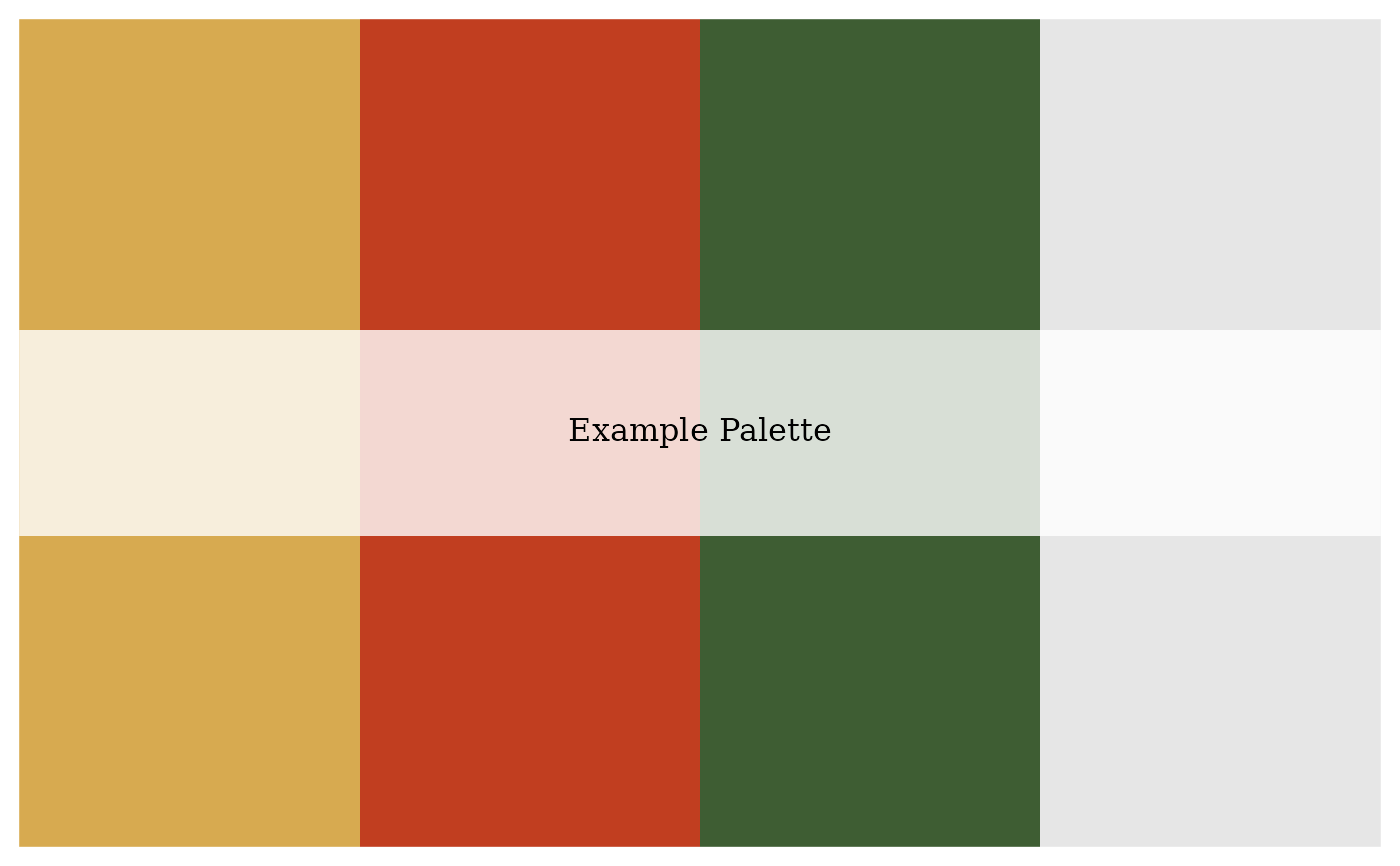
This function displays the color palette visually as an image plot.
The palette name, if it exists, will be displayed as a label on the plot.
Arguments
- x
A color palette represented as a vector of color hex codes.
- ...
Additional arguments to be passed to the underlying image and text functions.
Value
A plot displaying the color palette.
Examples
my_palette <- c("#D7AA50", "#C13E20", "#3E5D33", "#E6E6E6")
attr(my_palette, "name") <- "Example Palette"
print_palette(my_palette)