Study Guide: Test 1
Shaurita Hutchins
9/19/2021
Statistical Concepts
Load R Packages
The packages below are the ones that were used in modules 1 to 5. It’s best to load those at the very beginning.
library(tidyverse)## -- Attaching packages ------------------------------------------- tidyverse 1.3.1 --## v ggplot2 3.3.5 v purrr 0.3.4
## v tibble 3.1.4 v dplyr 1.0.7
## v tidyr 1.1.3 v stringr 1.4.0
## v readr 2.0.1 v forcats 0.5.1## -- Conflicts ---------------------------------------------- tidyverse_conflicts() --
## x dplyr::filter() masks stats::filter()
## x dplyr::lag() masks stats::lag()library(car)## Loading required package: carData##
## Attaching package: 'car'## The following object is masked from 'package:dplyr':
##
## recode## The following object is masked from 'package:purrr':
##
## somelibrary(broom)
library(knitr)
library(kableExtra)##
## Attaching package: 'kableExtra'## The following object is masked from 'package:dplyr':
##
## group_rowslibrary(QuantPsyc)## Loading required package: boot##
## Attaching package: 'boot'## The following object is masked from 'package:car':
##
## logit## Loading required package: MASS##
## Attaching package: 'MASS'## The following object is masked from 'package:dplyr':
##
## select##
## Attaching package: 'QuantPsyc'## The following object is masked from 'package:base':
##
## normlibrary(pastecs)##
## Attaching package: 'pastecs'## The following objects are masked from 'package:dplyr':
##
## first, last## The following object is masked from 'package:tidyr':
##
## extractlibrary(sciplot)Important Functions
- mean
- filter
- ggplot
summary(cars)## speed dist
## Min. : 4.0 Min. : 2.00
## 1st Qu.:12.0 1st Qu.: 26.00
## Median :15.0 Median : 36.00
## Mean :15.4 Mean : 42.98
## 3rd Qu.:19.0 3rd Qu.: 56.00
## Max. :25.0 Max. :120.00Including Plots
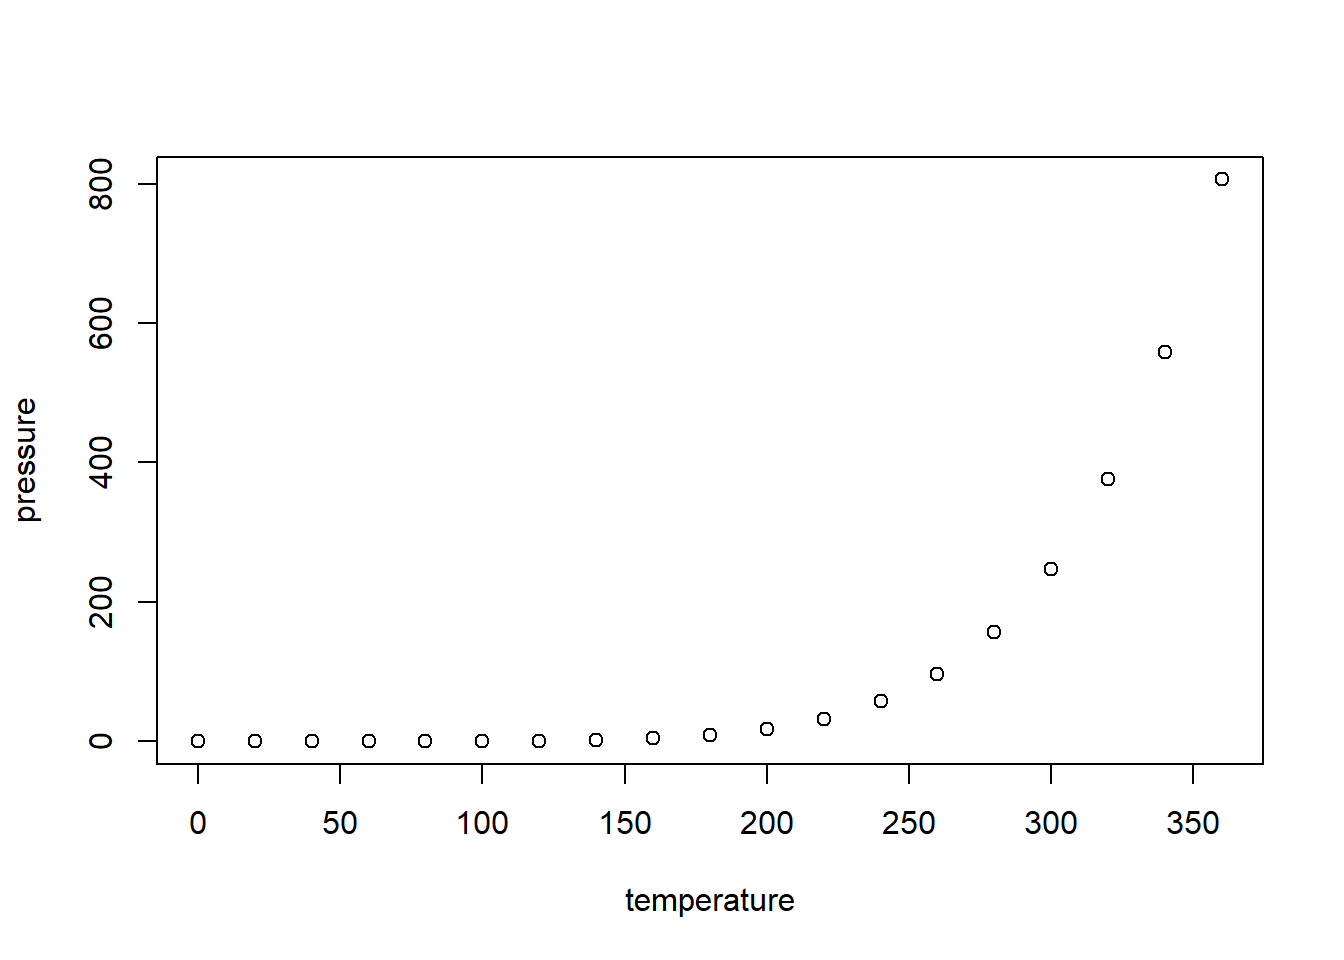
You can also embed plots, for example: